Thursday, December 31, 2009

Weekly 3LB Update for week ending 12/31/09

Weekly 3LB update (week ending 12/31/09)
a new high or low will change the reversal price and the midpoint

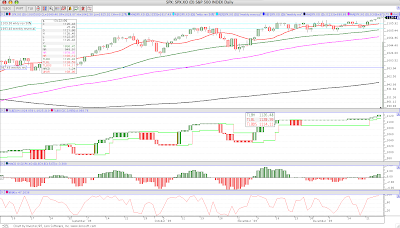
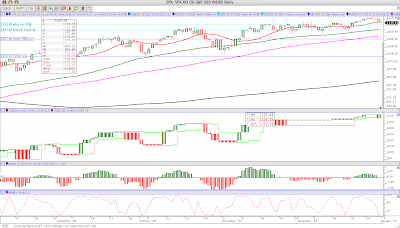
SPX -no change
trend=up
rev= 1093.48; mid= 1109.98
monthly info new high
trend=up; rev= 1020.62; mid= 1067.86

Chart of SPX:

Dow Jones -no change
trend=up
rev= 10318.16; mid= 10419.13
monthly new high
trend=up; rev= 9712.28; mid= 10070.17


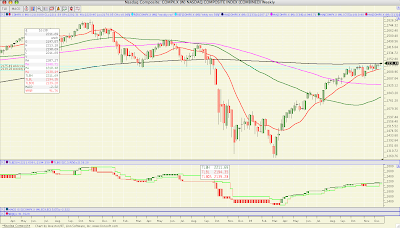
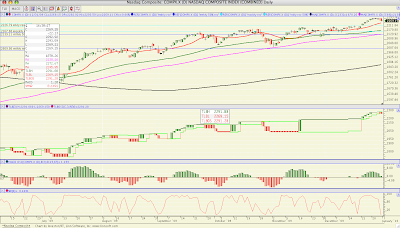
Nasdaq Comp -no change (still above weekly 233sma)
trend=up
rev= 2167.88; mid= 2226.79
monthly info new high
trend=up; rev= 2009.06; mid= 2139.11

Chart of Nasdaq Comp:

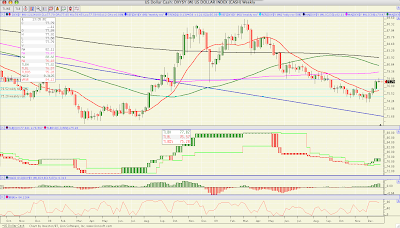
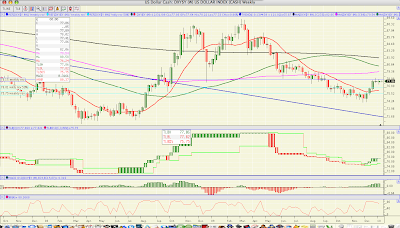
DXY -new high
trend=up;
rev= 75.75; mid= 76.81
monthly info -no change
trend=down; rev= 78.15; mid=76.52

Chart of DXY:

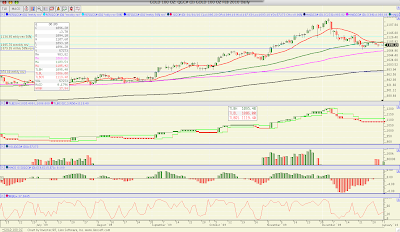
Gold -no change
trend=up
rev= 1095.70; mid= 1134.95
monthly info -no change
trend=up; rev= 978.80; mid= 1079.95

Chart of Gold:

10 Year -no change (almost had a reversal)
trend=no; direction=down (2 bars)
rev= 38.62; mid= 35.37

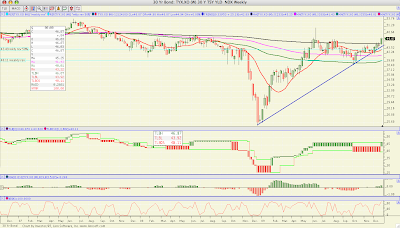
30 Year -no change (bearish thrusting candle so yield should keep increasing)
trend=no; direction=up (1 bar)
rev= 40.11; mid= 43.49


SLV -no change (sitting just above reversal...warning)
trend=up
rev= 16.50; mid= 17.36

BAC -no change (trading below mid...again and again and again and again)
trend=down
rev= 17.46; mid= 16.02

AXP -no change
trend=up
rev= 37.21; mid= 39.45

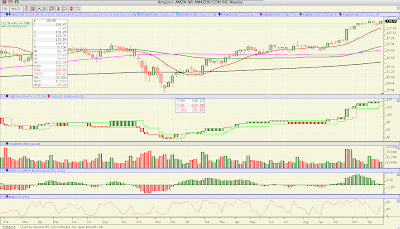
AMZN -no change (ALMOST a dark cloud but it's a bearish thrusting candle)
trend=up
rev= 126.20; mid= 132.34


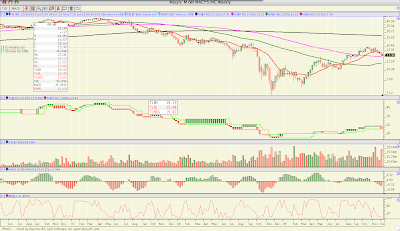
M -no change (had a weekly reversal but still needs confirmation week. Still not confirmed after 4 weeks)
trend=no; direction=down (1 bar)
rev= 19.82; mid= 17.90


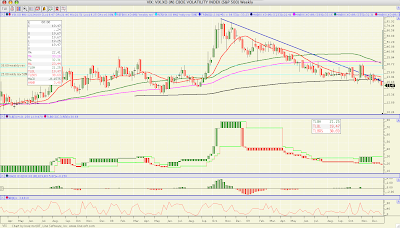
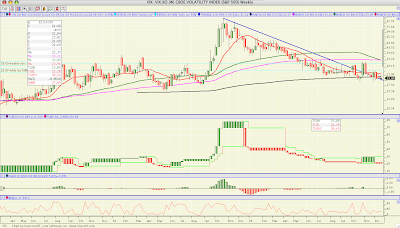
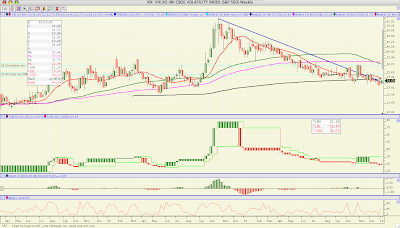
VIX -no change (trading above trend line)
trend=no; direction=down (2 bars)
rev= 30.69; mid= 25.08
Chart of VIX:

XLF -no change (trading above mid now)
trend=no; direction=down (1 bar for 9 weeks)
rev= 15.24; mid=14.65

BKX -no change (still trading below mid)
trend=no; direction=down (1 bar for 9 weeks)
rev= 47.69, mid= 44.96

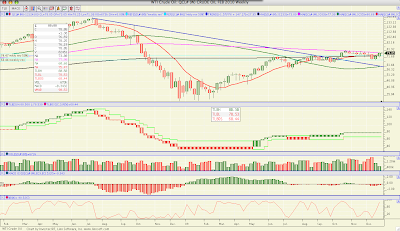
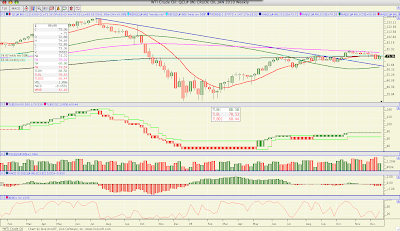
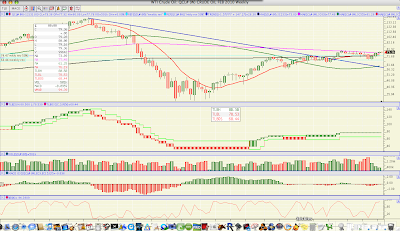
WTI Crude Oil -no change (Bullish piercing on candle 2 weeks ago. confirmed last week. closed higher this week)
trend=up
rev= 68.44; mid= 74.47
Chart of WTI:

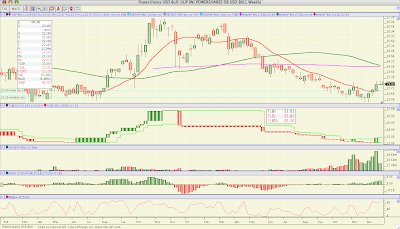
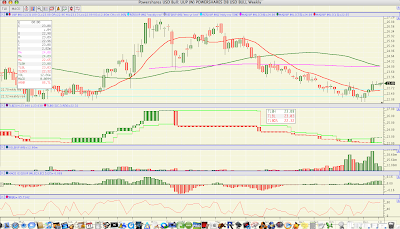
Powershares USD Bull (UUP) -new high
trend=up
rev=22.32; mid=22.70
Chart of UUP:

Goldman Sachs -no change
trend=no; direction=down (2 bars)
rev= 189.30; mid= 176.10

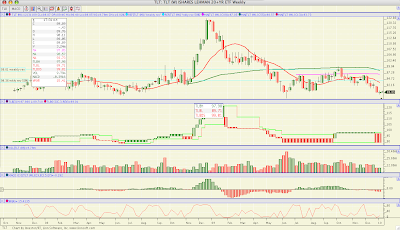
TLT -no change (possible morning star on weekly candle)
trend=no; direction=down (1 bar)
rev= 99.01; mid= 94.36
Chart of TLT:

Apple Computer -new high (possible evening star. getting congested)
trend=up
rev= 203.94; mid= 207.34
Chart of AAPL:


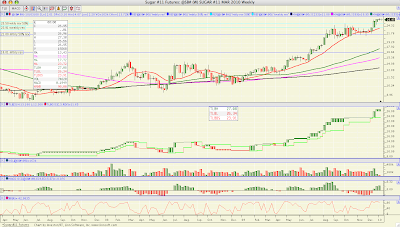
Sugar #11 -no change
trend=up
rev= 23.91; mid= 25.50
monthly info -new high
trend=up; rev= 16.81; mid= 21.88

Chart of Sugar #11:
Tuesday, December 29, 2009

S&P Yearly Closes

After going through the yearly closes for the S&P the 3LB range is 1469.25 to 740.74 with 1105.00 as the midpoint. So 1105 (IMO) is more important than 1121 (50% retrace). Just thought I'd toss that out there.

After some thought I think I still prefer the monthly 3LB to define the long term trend. There's so much that can happen in a year that gets missed using only yearly closes. So now having said that the current monthly 3LB for the S&P has a reversal of 987.48 and a midpoint of 1041.56. These will change as this month ends (kind of like a trailing stop).

Friday, December 25, 2009

Not sure about the rest of the Tech Sector but AAPL is doing just fine

...for now

AAPL -new high
trend=up
rev= 190.47; mid= 199.76

Recent low was 78.20 on 1/20/09.
Using fibonacci we see that AAPL had resistance at the 1.618% of 204.73. It tested that level for five weeks before finally closing above it this week. Next fibonacci level is 2.058% at 239.14 and 2.618% at 282.93.

Chart of AAPL:

Thursday, December 24, 2009

Weekly 3LB Update for week ending 12/24/09

Weekly 3LB Update (for week ending 12/24/09)
a new weekly high or low will change the reversal price and the midpoint

SPX -new high
trend=up
rev= 1093.48; mid= 1109.98
Chart of SPX:


Dow Jones -new high
trend=up
rev= 10318.16; mid= 10419.13

Nasdaq Comp -new high also closed above weekly 233sma
trend=up
rev= 2167.88; mid= 2226.79
Chart of Nasdaq Comp:


DXY -no change
trend=up
rev= 75.28; mid= 76.52
Chart of DXY:


Gold -no change (still trading below mid. almost had a weekly reversal)
trend=up
rev= 1095.70; mid= 1134.95
Chart of Gold:
see chart from 12/11/09

10 Year -no change (getting close to reversal)
trend=no; direction=down (2 bars)
rev= 38.62; mid= 35.37

30 Year -weekly reversal
trend=no; direction=up
rev= 40.11; mid= 43.49
Chart of TYX:


SLV -no change (still trading below mid)
trend=up
rev= 16.50; mid= 17.36

BAC -no change (trading below mid...again and again and again)
trend=down
rev= 17.46; mid= 16.02

AXP -new high (finally broke through to new highs)
trend=up
rev= 37.21; mid= 39.45

AMZN -new high
trend=up
rev= 126.20; mid= 132.34
Chart of AMZN:


M -no change (had a weekly reversal but still needs a confirmation week. Still not confirmed after 3 weeks)
trend=no; direction=down (1 bar)
rev= 19.82; mid= 17.90


VIX -new low (weekly reversal 3 weeks ago. had confirmation this week)
trend=no; direction=down (1 bar after 2 weeks)
rev= 30.69; mid= 25.08
Chart of VIX:


XLF -no change (still trading below mid)
trend=no; direction=down (1 bar for 9 weeks)
rev= 15.24; mid=14.65

BKX -no change (still trading below mid)
trend=no; direction=down (1 bar for 9 weeks)
rev= 47.69, mid= 44.96

WTI Crude Oil -no change (Bullish piercing on last weeks candle. confirmed this week)
trend=up
rev= 68.44; mid= 74.47
Chart of WTI:


Powershares USD Bull (UUP) -new high (looks like congestion. rally may have run out of steam.)
trend=no; direction=up
rev=22.26; mid=22.65
Chart of UUP:


Goldman Sachs (had a weekly reversal 4 weeks ago. finally confirmed last week. will it trend this week? so far no.)
trend=no; direction=down
rev= 189.30; mid= 176.10
Chart of GS:
see chart from 12/18/09

Saturday, December 19, 2009

Weekly 3LB update (week ending 12/11/09)
* indicates new chart,
a new high or low will change the reversal price and the midpoint

SPX -no change
trend=up;
rev= 1087.68; mid= 1097.05
Chart of SPX:
see chart from 12/11/09

Dow Jones -no change
trend=up
rev= 10270.47; mid= 10338.15

Nasdaq Comp -new high
trend=up;
rev= 2139.28; mid= 2175.49
Chart of Nasdaq Comp:


DXY* -new high (now trending up. let's see how long before stocks react)
trend=up;
rev= 75.28; mid= 76.52
Chart of DXY:


Gold -no change (still trading below mid)
trend=up
rev= 1095.70; mid= 1134.95
Chart of Gold:
see chart from 12/11/09

10 Year -no change (still trading above mid)
trend=no; direction=down (2 bars)
rev= 38.62; mid= 35.37

SLV -no change (still trading below mid)
trend=up
rev= 16.50; mid= 17.36

BAC -no change (trading below mid...again and again)
trend=down
rev= 17.46; mid= 16.02

AXP -no change (still trading above mid but is showing weakness)
trend=up
rev= 34.95; mid= 37.94

AMZN* -no change (dark cloud cover confirmed. tested mid)
trend=up
rev= 118.81; mid= 128.06
Chart of AMZN:


M -new low (WEEKLY REVERSAL still needs confirmation week. Still not confirmed after 2 weeks)
trend=no; direction=down (1 bar)
rev= 19.82; mid= 17.90


VIX* -no change (Had a weekly reversal. Still no confirmation this week)
trend=no; direction=down (1 bar after 2 weeks)
rev= 30.69; mid= 25.97
Chart of VIX:


XLF -no change (still trading below mid)
trend=no; direction=down (1 bar for 8 weeks)
rev= 15.24; mid=14.65

BKX -no change (still trading below mid)
trend=no; direction=down (1 bar for 8 weeks)
rev= 47.69, mid= 44.96

WTI Crude Oil* -no change (still trading below mid even after the scare. Bullish piercing on weekly candle)
trend=up
rev= 68.44; mid= 74.47
Chart of WTI:


Powershares USD Bull* (UUP) (WEEKLY REVERSAL)
trend=no; direciton=up
rev=22.26; mid=22.64
Chart of UUP:


Goldman Sachs* (had a weekly reversal 3 weeks ago. finally confirmed this week. will it trend?)
trend=no; direction=down
rev= 189.30; mid= 176.10
Chart of GS:

Tuesday, December 15, 2009

DXY Monthly View

Decided to take a quick look at the monthly DXY to see if its mid or reversal are coming into play. The answer is yes as we have closed above the mid. Sentiment is turning positive which may lead to a reversal of the downtrend.

trend=down
rev= 78.15; mid= 76.52
Monthly chart of DXY:


***Also noted that this reversal is also seen in Andy T's Dollar Update which is a must read.

Saturday, December 12, 2009

Weekly 3LB Update for week ending 12/11/09

Weekly 3LB update (week ending 12/11/09)
* indicates new chart,
a new high or low will change the reversal price and the midpoint

SPX* -new high
trend=up;
rev= 1087.68; mid= 1097.05
Chart of SPX:


Dow Jones -new high
trend=up
rev= 10270.47; mid= 10338.15

Nasdaq Comp -no change
trend=no; direction=up (2 bars)
rev= 2045.11; mid= 2119.73

DXY* -new high (WEEKLY REVERSAL last week. Confirmed this week. Now will it trend?)
trend=no; direction=up (2 bars)
rev= 74.86; mid= 75.72
Chart of DXY:


Gold -no change (now trading below mid)
trend=up
rev= 1095.70; mid= 1134.95
Chart of Gold:


10 Year -no change (now trading above mid)
trend=no; direction=down (2 bars)
rev= 38.62; mid= 35.37

SLV -no change (now trading below mid)
trend=up
rev= 16.50; mid= 17.36

BAC -no change (trading below mid...again)
trend=down
rev= 17.46; mid= 16.02

AXP -no change
trend=up
rev= 34.95; mid= 37.94

AMZN -no change (possible dark cloud cover on weekly chart)
trend=up
rev= 118.81; mid= 128.06
Chart of AMZN:


M -new low (WEEKLY REVERSAL still needs confirmation week. Not confirmed...yet)
trend=no; direction=down (1 bar)
rev= 19.82; mid= 17.90
Chart of Macy's:

VIX -new low (WEEKLY REVERSAL last week. No confirmation this week)
trend=no; direction=down (1 bar)
rev= 30.69; mid= 25.97
Chart of VIX:


XLF -no change (trading below mid)
trend=no; direction=down (1 bar for 7 weeks)
rev= 15.24; mid=14.65

BKX -no change (trading below mid)
trend=no; direction=down (1 bar for 7 weeks)
rev= 47.69, mid= 44.96

WTI Crude Oil -no change (now trading below mid)
trend=up
rev= 68.44; mid= 74.47
Chart of WTI:


Powershares USD Bull (UUP) (now trading above mid)
trend=no; direciton=down (2 bars)
rev=22.83; mid=22.55
Chart of UUP:


Edit: Adding Sugar #11 info
Weekly
trend=up
rev= 23.52; mid= 23.76

Monthly
trend=up
rev= 15.58; mid= 19.99

Weekly Chart of Sugar #11:


Monthly Chart of Sugar #11:

Wednesday, December 9, 2009

GS update

trend=no
direction=down (1 bar for 2 weeks)
rev= 189.30
mid= 176.73
Didn't realize they had a weekly reversal back on 11/27/09. But once it starts....
Chart of GS:

Sunday, December 6, 2009

Wilshire, Apple, 30 Year Bond

Wilshire 5k - new high (WEEKLY REVERSAL after 5 weeks of consolidation)
rev= 10655.73; mid= 11005.82
Chart of Wilshire:


AAPL -no change (trading below mid, bias turning negative)
rev= 185.02; mid= 194.68
Chart of Apple:


30yr Bond -no change (yield now trading above mid)
rev= 46.56; mid= 43.34
If this continues then auctions are going to require higher yields to be successful.
Chart of 30yr bond yield:

Saturday, December 5, 2009

Weekly 3LB Update for week ending 12/4/09

Weekly 3LB update (week ending 12/4/09)
* indicates new chart
a new high or low will change the reversal price and the midpoint

SPX* -new high
trend=up;
rev= 1071.49; mid= 1088.74
Chart of SPX:


Dow Jones -new high
trend=up
rev= 10023.42; mid= 10206.16

Nasdaq Comp -new high
trend=no; direction=up (2 bars)
rev= 2045.11; mid= 2119.73

DXY* -new high (WEEKLY REVERSAL needs confirmation week)
trend=no
rev= 74.86; mid= 75.31
Chart of DXY:


Gold* -no change (had a mild correction but no reversal)
trend=up
rev= 1095.70; mid= 1134.95
Chart of Gold:


10 Year -new low
trend=no; direction=down (2 bars)
rev= 38.62; mid= 35.37

SLV -no change
trend=up
rev= 16.50; mid= 17.36

BAC -no change (trading above mid)
trend=down
rev= 17.46; mid= 16.02

AXP -no change (still trading above mid)
trend=up
rev= 34.95; mid= 37.94

AMZN* -new high
trend=up
rev= 118.81; mid= 128.06
Chart of AMZN:


M* -new low (WEEKLY REVERSAL still needs confirmation week)
trend=no; direction=down (1 bar)
rev= 19.82; mid= 17.90
Chart of Macy's:


VIX* -new low (WEEKLY REVERSAL)
trend=no; direction=down (1 bar)
rev= 30.69; mid= 25.97
Chart of VIX:


XLF -no change (trading below mid)
trend=no; direction=down (1 bar for 6 weeks)
rev= 15.24; mid=14.65

BKX -no change (trading below mid)
trend=no; direction=down (1 bar for 6 weeks)
rev= 47.69, mid= 44.96

WTI Crude Oil -no change
trend=up
rev= 68.44; mid= 74.47

Wednesday, December 2, 2009

Nikkei

Nikkei weekly 3LB update.

The Nikkei is making a move towards the weekly reversal midpoint after testing the 55sma. We'll see if it's real as it approaches the midpoint. I suspect a headfake is in the works.

This is one of the reasons why I like the three line break charts. Here is a long term 3LB of the S&P 500 showing dates of the change in direction. The chart is independent of time. A new candle is drawn when the price targets are hit. That's why you can get a 1966-2009 chart on one page. You can also expand the chart by having bars repeat until a new bar is drawn. That helps the chart line up to the candlestick charts.

Monday, November 30, 2009

The Weekly 3LB Updates

Weekly 3LB update (week ending 11/27/09)
* indicates new chart, nc=no change

SPX -nc
trend=no; direction=up (1 bar)
rev= 1042.73; mid= 1068.11
Chart of SPX:


Dow Jones -nc
trend=up
rev= 9995.91; mid= 10157.04

Nasdaq Comp -nc
trend=no; direction=up (1 bar)
rev= 2045.11; mid= 2106.50

DXY*
trend=down
rev= 75.58; mid= 75.28
Chart of DXY:


Gold*
trend=up
rev= 1095.70; mid= 1134.95
Chart of Gold:


10 Year -nc
trend=no; direction=down (still 1 bar after 9 wks)
rev= 38.62; mid= 35.42

SLV -nc
trend=up
rev= 16.50; mid= 17.36

BAC -nc (holding above mid)
trend=down
rev= 17.46; mid= 16.02

AXP
trend=up
rev= 37.21; mid= 39.11

AMZN -nc
trend=up
rev= 118.49; mid= 125.73

M -nc (still below mid)
trend=up
rev= 16.07; mid= 17.95

VIX -nc
trend=no; direction=up (1 bar for 6 weeks)
rev= 21.43; mid= 26.06
Chart of VIX:


XLF -nc
trend=no; direction=down (1 bar)
rev= 15.24; mid=14.65

BKX -nc
trend=no; direction=down (1 bar)
rev= 47.69, mid= 44.96

WTI Crude Oil -nc
trend=up
rev= 68.44; mid= 74.47
Chart of WTI Crude Oil: